The Lab · instrument 11/16 · interactive
Does 0.9 mean 90%?
Distort a model's confidence, watch the reliability diagram bend, then calibrate it — and discover that the threshold you already chose no longer means what you picked it for.
What's real here
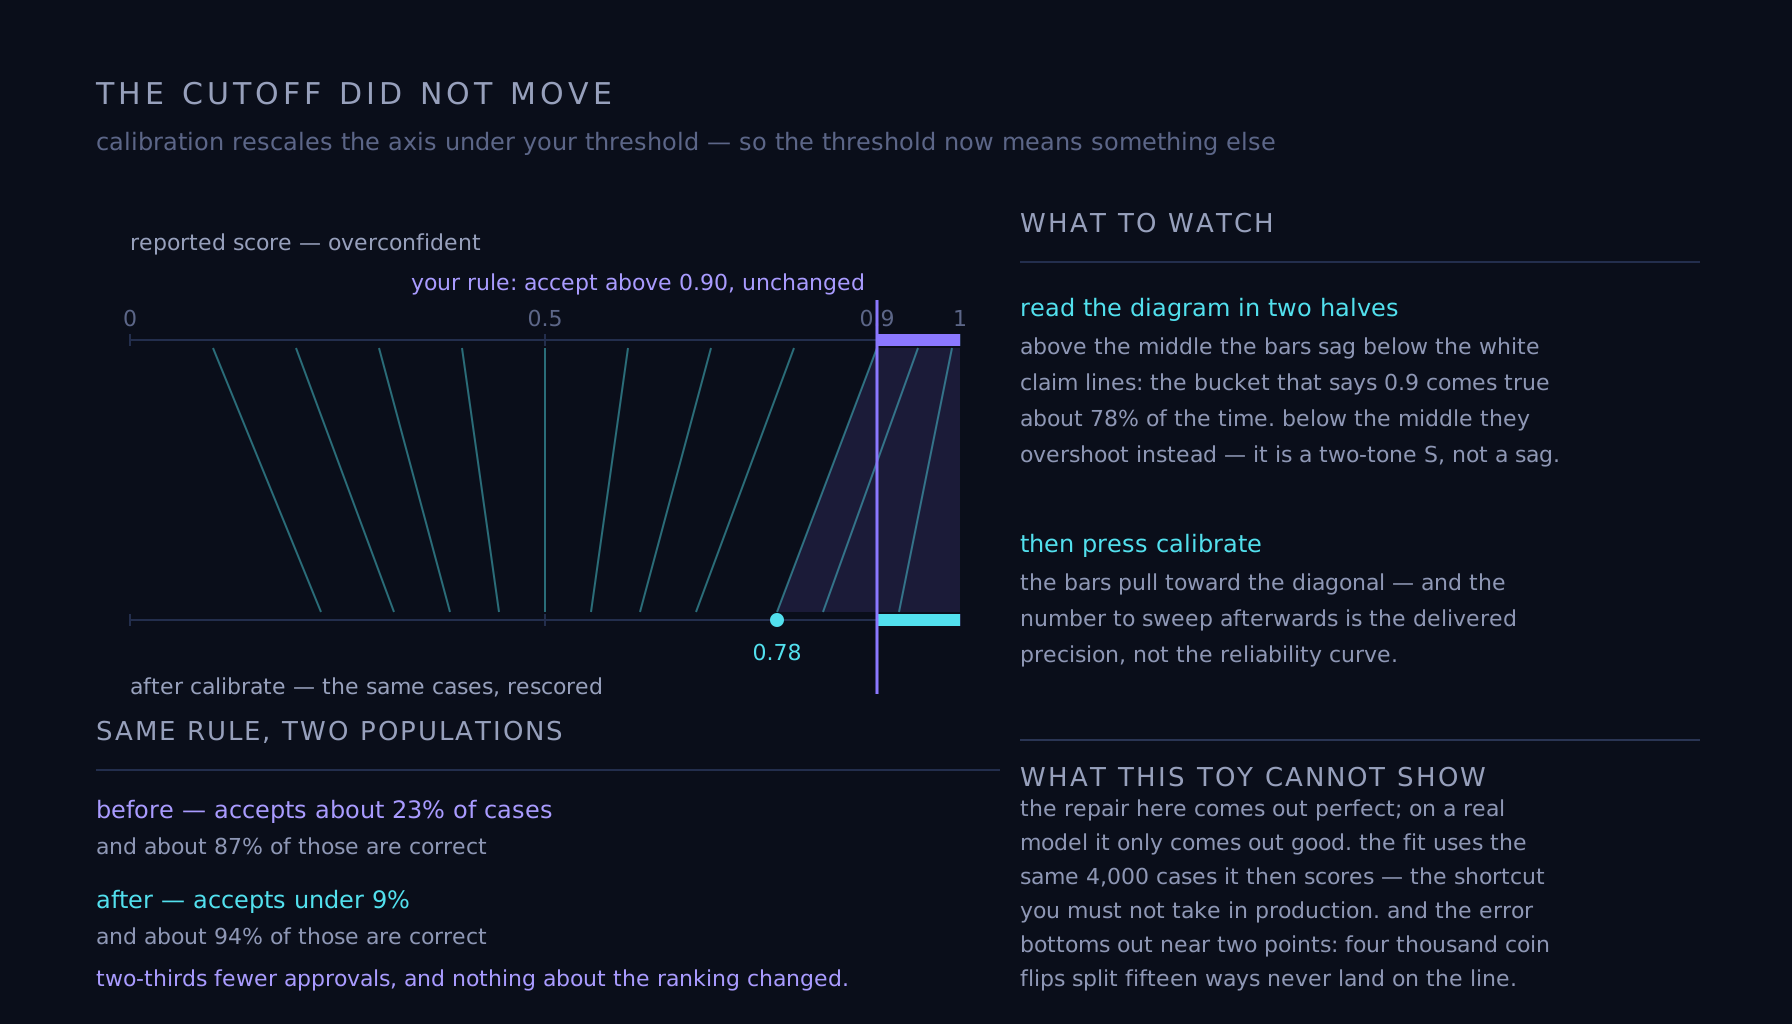
Each case has a true probability, and its label is drawn honestly from that probability — so the data never lies. What the slider distorts is only the reported score, by the same temperature transform used to fix real models — which is why the repair here comes out perfect and on a real model it only comes out good. Two other disclosures, since this section exists for them: the fit uses the same 4,000 cases it then scores, exactly the shortcut you must not take in production; and expected calibration error bottoms out near two points here, because four thousand coin flips split fifteen ways never land precisely on the diagonal.
Where to push
Start overconfident, the usual failure — and read the diagram in two halves. Above the middle the bars sag below the white claim lines: the bucket that says 0.9 comes true about 78% of the time. Below the middle they overshoot instead, because sharpening pushes low scores too far down as well; that two-tone S is what overconfidence actually looks like, not a uniform sag. Now press calibrate and watch the bars pull in toward the diagonal. Then look at the right-hand panel: the share of cases your unchanged 0.90 rule accepts collapses from about 23% to under 9%, while its precision climbs from 87% to 94%. Same cutoff, two-thirds fewer approvals, because a fixed probability threshold is measured against a scale you just rescaled. Nothing about the model's ranking changed; your operating point did.
Failure mode
Calibrating and keeping your old threshold. It is the natural thing to do — the fix "preserves accuracy," so why touch the rule? — and it silently ships a different system, accepting a different population at a different precision. Calibration changes what the numbers mean, so every cutoff derived from the old meaning has to be derived again: sweep the threshold, read the delivered-precision number in the right panel — not the reliability curve, which answers a different question — and stop where it clears what you need. Then remember the fitted temperature is only valid on data resembling the fit set; under shift, both it and the threshold need re-checking.