Computer Vision · entry 02/06 · 2 min read
Detection & segmentation
Classification names the picture; detection boxes every object; segmentation claims each pixel — and the metrics that rank these systems are exactly where intuition goes to die.
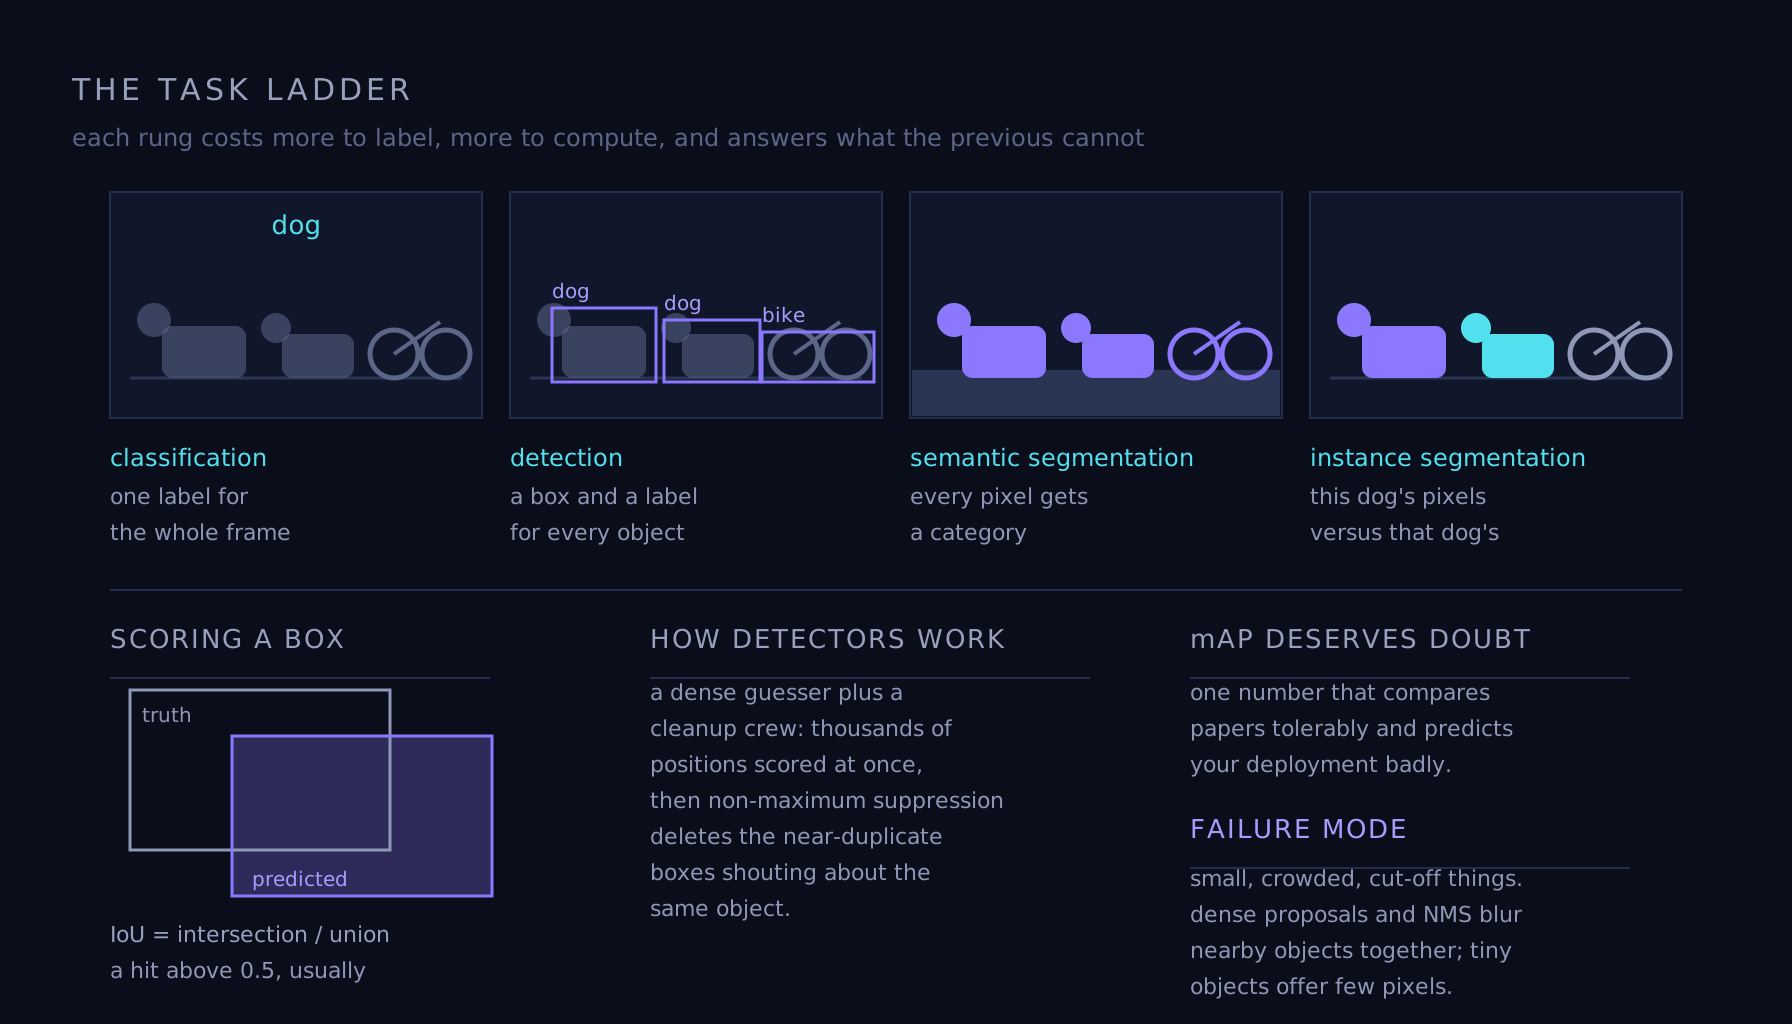
The task ladder
Vision tasks stack by precision of the question. Classification: one label for the whole frame. Detection: a box and a label for every object — two dogs, one bike, there and there. Segmentation: a per-pixel verdict, either by category (semantic — all "road" pixels) or by instance (this dog's pixels versus that dog's). Each rung costs more to label, more to compute, and answers questions the previous rung cannot: you don't count sheep with a classifier, and you don't measure a tumor with a bounding box.
How detectors actually work
A detector is a dense guesser plus a cleanup crew. The network proposes, for thousands of positions and sizes at once, "objectness" scores, class guesses, and box adjustments; then non-maximum suppression deletes the near-duplicate boxes shouting about the same object. Two-stage designs (propose regions, then classify each carefully) bought accuracy; single-shot families like YOLO made the whole thing one forward pass and put detection on webcams, drones and phones at real-time rates. The frontier moved again with open-vocabulary detectors that match regions against text descriptions — box what you can phrase, sturdily for common categories and shakily for rare or compositional ones, courtesy of vision-language training — and with promptable segmenters like SAM, which return a clean mask for whatever you click. Increasingly you assemble these like tools rather than train from scratch.
The metrics deserve suspicion
Boxes are scored by IoU — intersection over union with the true box — and a detection "counts" above some IoU threshold, usually 0.5. Sweep the confidence threshold, trace precision against recall, average it all into mAP, and you get one number that compares research papers tolerably and predicts your deployment badly. mAP averages over classes and object sizes you may not care about, at IoU standards your product may not need, on a benchmark's object mix instead of yours. The discipline from evaluating models applies doubled: pick the operating point — one threshold, your classes, your costs for a miss versus a false alarm — and measure there.
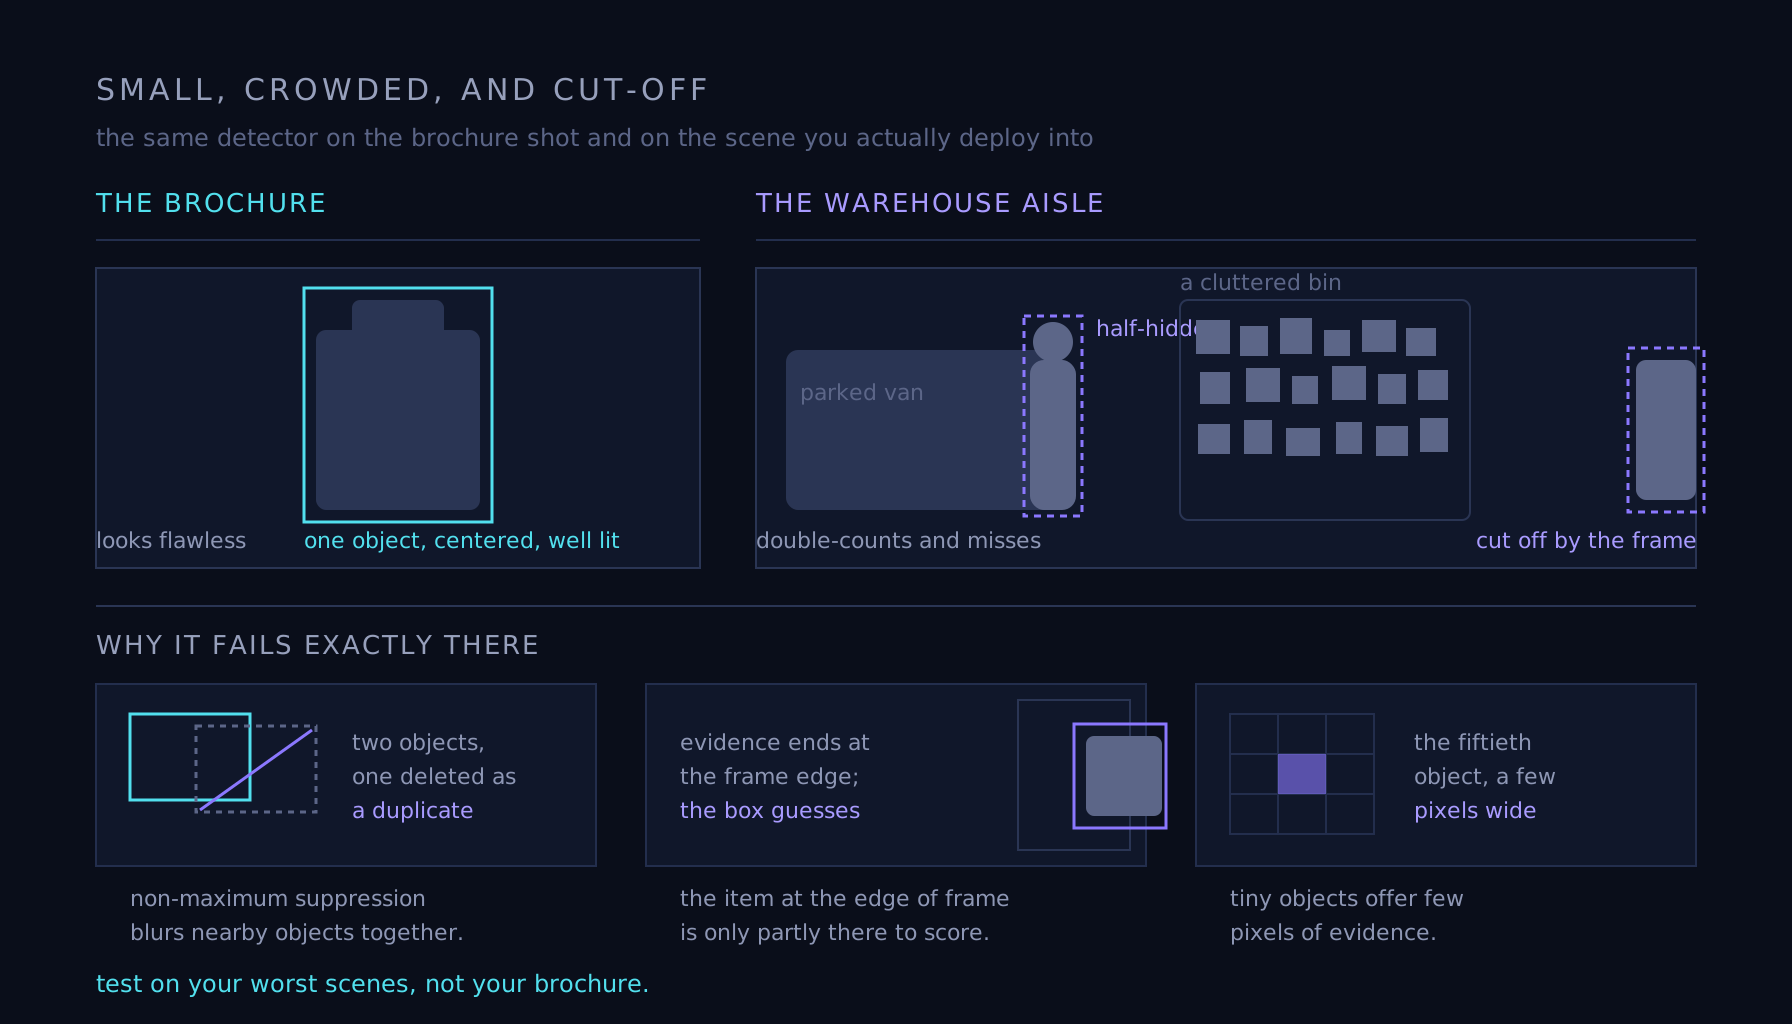
Failure mode
Small, crowded, and cut-off things. Detectors are at their worst exactly where scenes get interesting — the pedestrian half-hidden by a parked van, the fiftieth object in a cluttered bin, the item at the edge of frame — because dense proposals and NMS both blur nearby objects together, and tiny objects offer few pixels of evidence. A detector that looks flawless on centered product shots will double-count or miss in a warehouse aisle. Test on your worst scenes, not your brochure.